
The average Maidstone home sold for £352,309 in May 2026 (Land Registry). Prices by type, the priciest streets, and why Rightmove says £382k.
Ask three people what a house in Maidstone costs and you will get three different numbers, because the asking prices in agents’ windows, the portal averages and the official sold-price record all measure different things. The figure that settles the argument is the one built from completed sales, recorded by HM Land Registry when each purchase goes through. This page is a plain read of those numbers for the Maidstone borough: the current average, which way it is moving, what each property type costs, the most expensive corners, and how the town compares with Kent and England.
The headline figure
The average home in the Maidstone borough sold for £352,309 in May 2026. That is the provisional figure from the official UK House Price Index, which is calculated from completed Land Registry sales rather than asking prices.
Over the twelve months to May 2026 prices rose just 0.4%, and the May figure was actually 0.9% down on April. Earlier in the year the annual rate was a little stronger, 2.3% in January, but it has faded month by month since. In short, the Maidstone market of 2026 is flat: holding its value, not climbing. Sales activity tells the same story; the borough recorded 137 sales in March 2026, the most recent month with a published count, which is a modest number for a borough this size.
One caution on any figure you see elsewhere. Search Rightmove and you will find an average of about £382,000 for Maidstone. That is not a contradiction: Rightmove’s number is a simple average of its recorded sold prices over the past year, while the Land Registry index adjusts for the mix of homes actually sold and covers the whole borough, from central terraces to village houses out at Headcorn and Marden. Both are real. Always check what area and what method sits behind a number before you compare it with another.
What it means for you
If you are selling, a flat market with modest sales volumes means realistic pricing matters more than it did in the 2021 to 2022 run-up; overpriced homes sit. If you are buying, there is little pressure from rising prices, so you have time to compare and room to negotiate, especially on flats, which have fallen in value over the year. Factor in the council tax band of anything you view, since that is a running cost buyers routinely overlook. If you are staying put, your home is worth roughly what it was a year ago in cash terms, which after the strong gains of 2021 and 2022 is a soft landing rather than a slide.
Prices by property type
The borough average hides a wide spread. These are the Maidstone figures for May 2026 from the UK House Price Index:
- Detached houses: £610,900, up 0.6% over the year.
- Semi-detached houses: £378,121, up 1.8%, the strongest performer.
- Terraced houses: £294,163, up 1.1%, the main route in for house buyers on a budget.
- Flats and maisonettes: £181,437, down 3.1%, the one falling category.
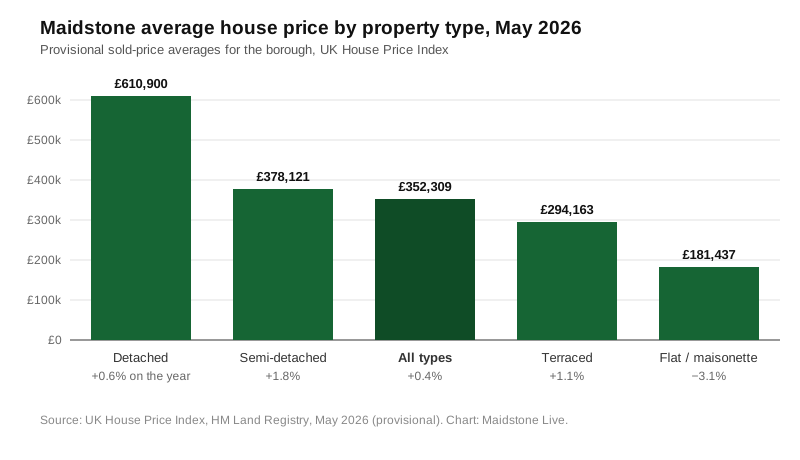
The pattern matches the rest of Kent: houses with gardens have held or edged up, while flats have softened, partly because flat buyers are the most exposed to mortgage rates and partly because demand since the pandemic has tilted toward space.
First-time buyers and home movers
The same index splits buyers usefully. A first-time buyer in Maidstone paid an average of £291,700 in May 2026, almost exactly the price of the average terraced house. A home mover paid £427,778. The £136,000 gap between the two is, in effect, the cost of trading up from a first home to a family house in this borough.
The most expensive streets and areas
Sold-price records compiled by Property Solvers from Land Registry repeat sales (their street tool was last updated in March 2022, so treat these as a map of where the money sits rather than today’s values) put the borough’s priciest addresses on the rural fringes rather than in town:
- Ashford Road, Bearsted side (ME14), averaging around £2.5 million, the standout address in the borough.
- Church Lane and St Faiths Lane, Bearsted (ME14), both averaging £1.1 million to £1.6 million.
- Queens Avenue (ME16), west Maidstone’s most expensive road at around £1 million to £1.2 million.
- Farleigh Hill and Old Drive (ME15), the top of the market south of the town at around £900,000.
At the other end, central Maidstone is the cheapest corner of the whole county by postcode sector: ME14 1, the town centre, averages £196,000, the lowest of any sector in Kent according to Plumplot’s Land Registry analysis. The rule of thumb is simple: values climb as you move out from the town centre toward Bearsted, the Loose valley and the villages.
How Maidstone compares with Kent and England
Maidstone sits a little above the Kent average, below the South East, and well above England as a whole.
| Area | Average price | Annual change |
|---|---|---|
| Maidstone borough | £352,309 | +0.4% |
| Kent county | £345,918 | +1.6% |
| South East region | £381,311 | +1.2% |
| England | £292,095 | +2.3% |
Source: UK House Price Index, May 2026, all figures provisional.
In plain terms, the average Maidstone home costs about £6,000 more than the typical Kent home and £60,000 more than the typical home in England, but around £29,000 less than the South East average. What holds prices here is the practical offer of the county town: direct trains to London, grammar schools, and village stock within a short drive of the M20. What caps them is supply: Maidstone has approved a lot of new housing over the past decade, and more is planned under the borough’s Local Plan.
Frequently asked questions
What is the average house price in Maidstone?
The average home in the Maidstone borough sold for £352,309 in May 2026, according to the provisional UK House Price Index built from HM Land Registry completions. Portal averages based on raw sold prices, like Rightmove’s £382,000, run higher because they measure a different mix.
Are Maidstone house prices going up or down in 2026?
They are broadly flat. Prices rose just 0.4% in the year to May 2026, and the annual rate has been fading since January. Flats are the exception, down about 3.1% over the year.
How much is a detached house in Maidstone?
A detached house in the borough averaged £610,900 in May 2026, a little over double the price of an average terraced house at £294,163.
Is Maidstone expensive compared with the rest of Kent?
Slightly. The borough average of £352,309 sits about £6,000 above the Kent county average of £345,918, but below neighbouring commuter districts and about £29,000 below the South East regional average.
Where are the most expensive houses in Maidstone?
On the eastern and southern fringes: Ashford Road and the lanes around Bearsted top the Land Registry repeat-sales record at over £1 million, with Queens Avenue in ME16 the priciest road west of the centre. Central Maidstone’s ME14 1 is the cheapest postcode sector in Kent at £196,000.
Where can I check what a specific house sold for?
Every completed sale in England and Wales is public. Look up any street or address free on the HM Land Registry Price Paid search, or browse the same records on Rightmove and Zoopla.
Sources
- UK House Price Index, Maidstone (ONS / HM Land Registry) for the borough average, property-type and buyer-type figures.
- UK House Price Index for May 2026, England summary (GOV.UK) for the England figure and release notes.
- HM Land Registry UKHPI data service for the Kent, South East and monthly Maidstone series.
- Plumplot Kent house prices (Land Registry price paid analysis) for the postcode-sector extremes.
- Property Solvers most and least expensive streets for street-level repeat-sales averages (last updated March 2022).
- Rightmove Maidstone house prices for the portal comparison.
- HM Land Registry Price Paid search to check any individual address.
The May 2026 figures are provisional and are revised as more sales complete; the next UK House Price Index release is 19 August 2026. Confirm the latest numbers against the linked sources before making a decision. New to the area? Our guides to council tax bands, parking and bin collections cover the practical side of moving in.
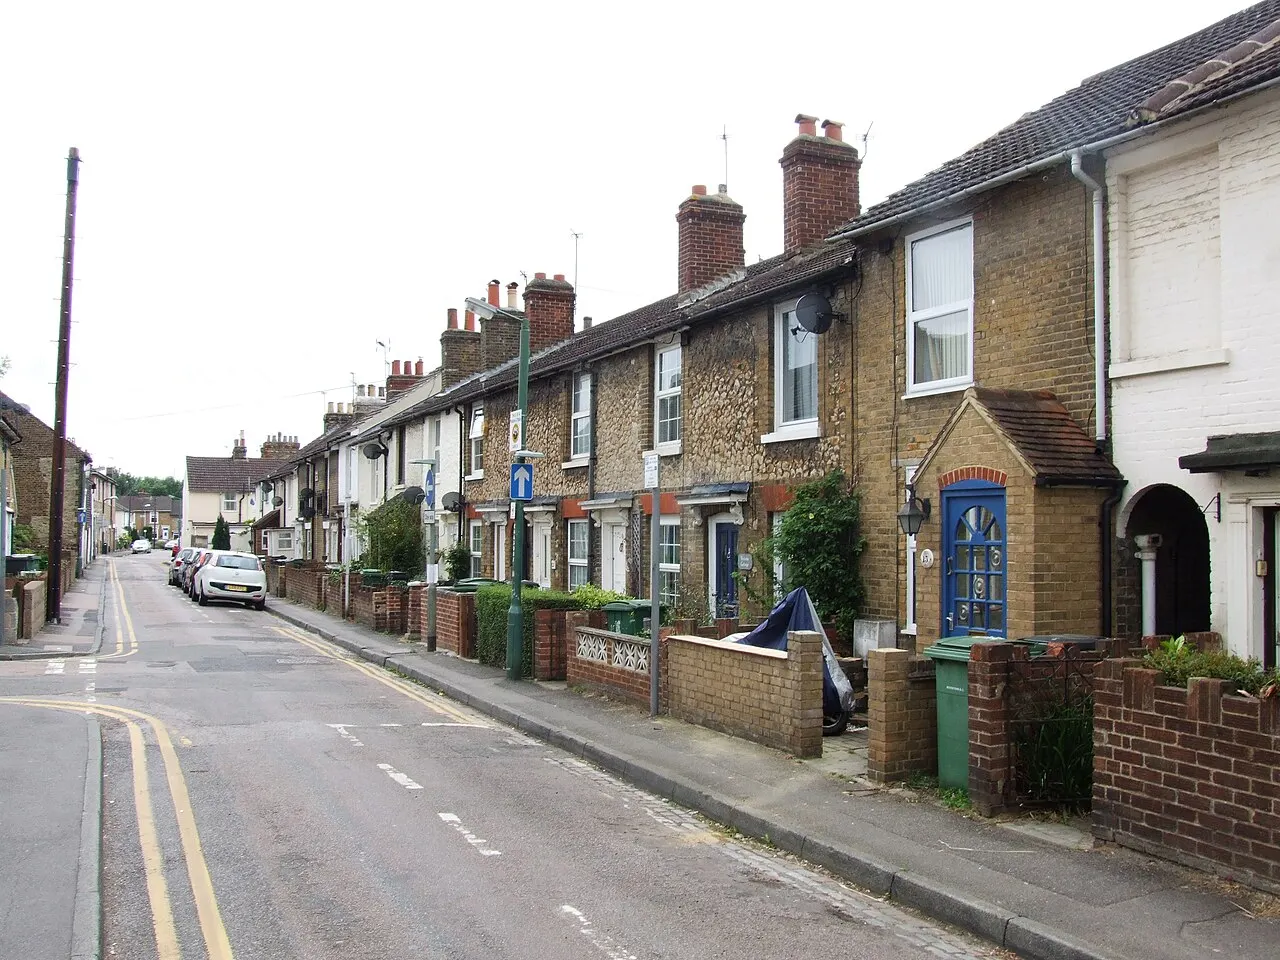
Image: “Albert Street, Maidstone” by Chris Whippet, CC BY-SA 2.0, via Wikimedia Commons (https://commons.wikimedia.org/wiki/File:Albert_Street,Maidstone-geograph.org.uk-_3551247.jpg).
Have your say